This is the Data Visualization section of GREASE’s info package on state-religion governance indicators. For more, please see our Overview, Comparative Insights, Toolkit and Country Assessments.
Interactive illustration of GREASE State-Religion Governance Indicators applied to 23 countries
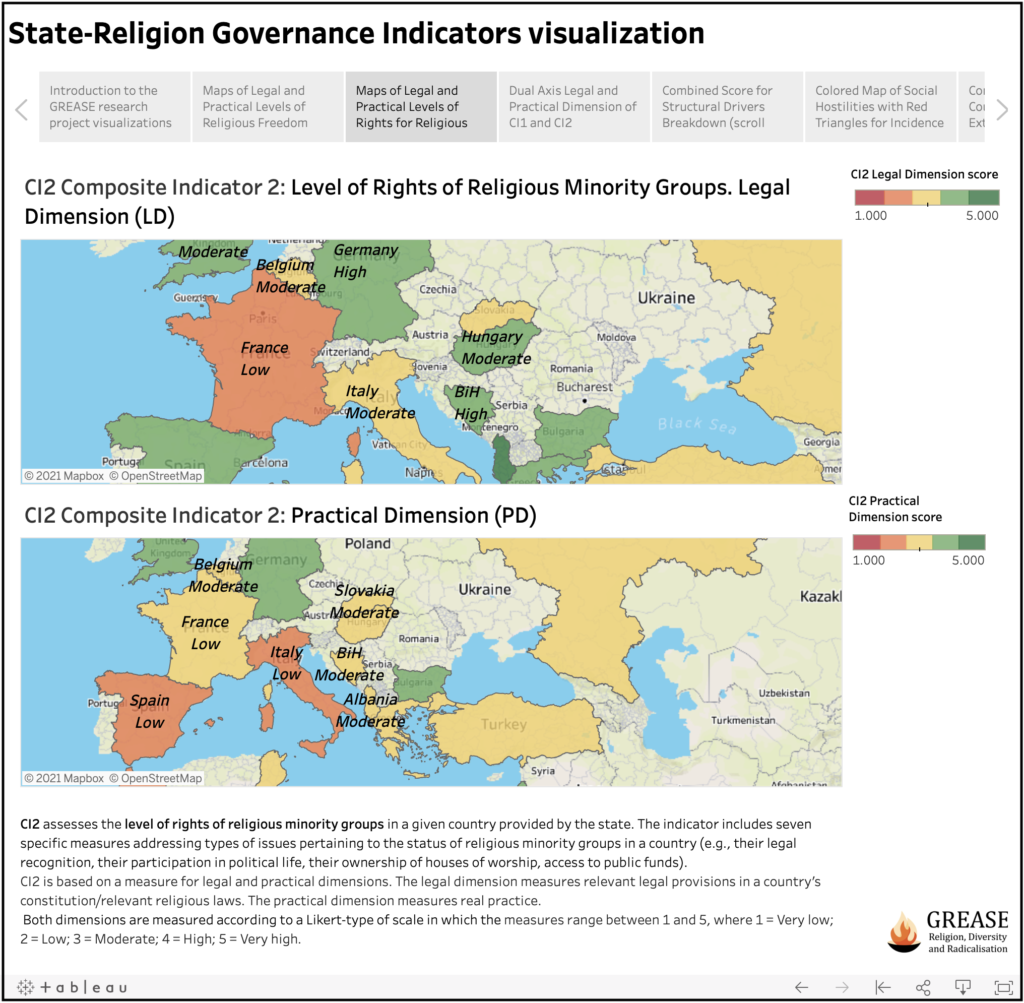
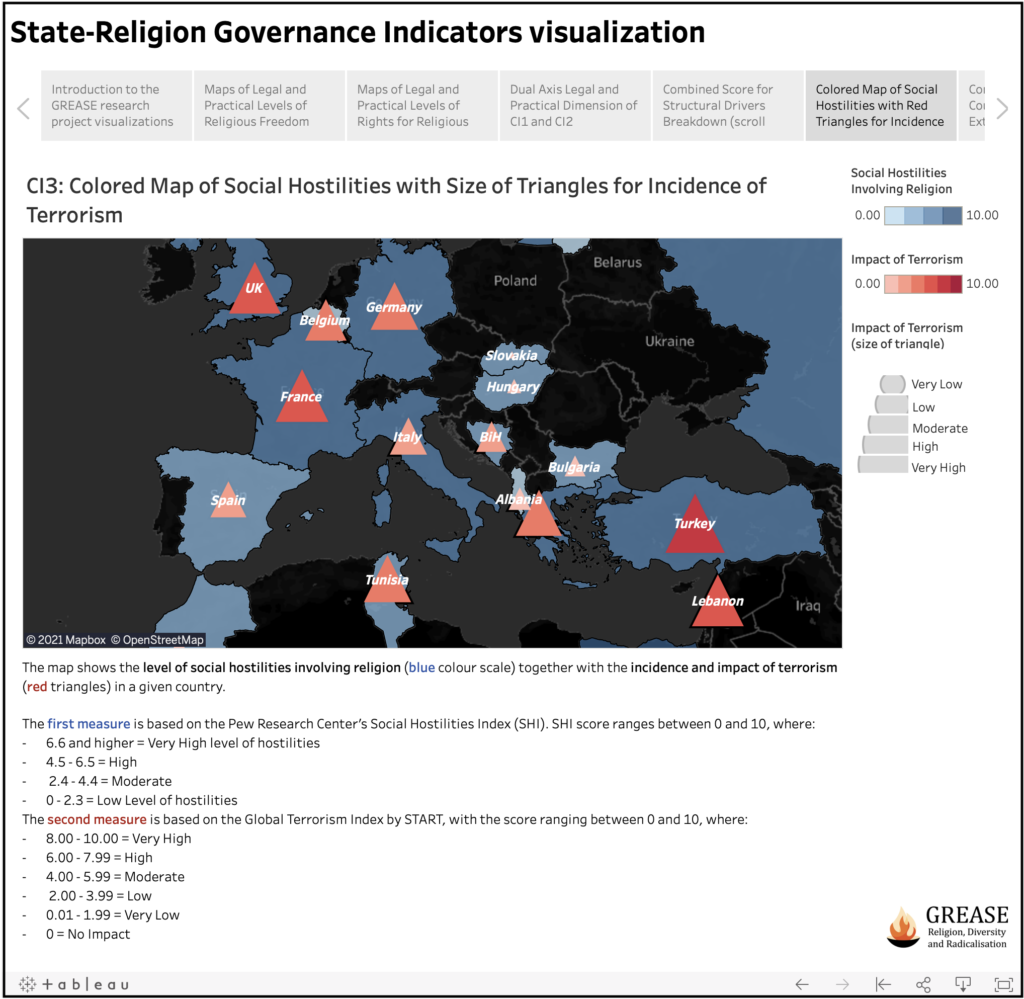
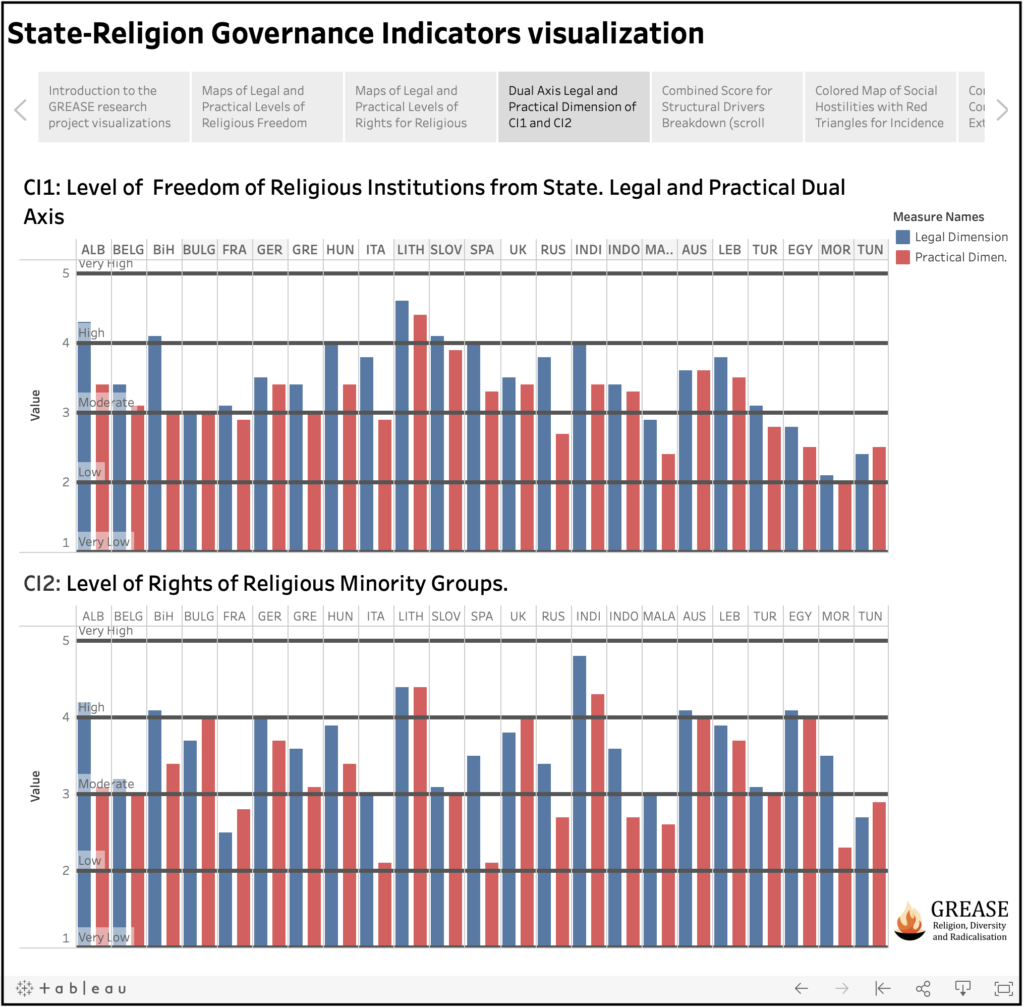
Results of the GREASE project’s assessment of state-religion governance in 23 countries can be accessed through a map-based visualization interface. The interface has two main functions: (1) illustrating our country assessment findings and (2) simplifying access to country indicators using basic digital tools (hovering and clicking).
TWO WAYS TO ACCESS GREASE INDICATORS VISUALIZATION
Option 1: Click here using a standard web browser.
Option 2: First download and install the free software application Tableau Reader. Then, using your web browser, open this page and click “Download” at the top right. That should enable you to open the file with your preinstalled Tableau Reader for navigating the indicators offline (faster data flow).